
Photo by Scott Rodgerson on Unsplash
To troubleshoot AWS infrastructure with an AI CLI, start from the symptom and ask one narrow question at a time: which alarms are firing, what the metrics did around that time, what the logs say, and what changed. ChatWithCloud turns each question into AWS SDK calls that run on your machine with your profile, so a read-only profile is enough for the whole investigation.
This guide is for engineers who get paged and want answers faster than clicking through CloudWatch, CloudTrail and five service consoles. You’ll leave with a repeatable question sequence, an IAM policy scoped to read-only troubleshooting, and a clear idea of where an AI CLI helps and where you still need to look yourself.
ChatWithCloud is a command-line tool that answers questions about your AWS account in plain English. It doesn’t replace your monitoring. It shortens the gap between “something is wrong” and “here’s the resource, the error and the change that caused it.” If you haven’t set it up yet, install the ChatWithCloud CLI with npx or Homebrew first; the AWS cost, security and troubleshooting use cases show where it fits alongside your existing tooling.
How do you troubleshoot AWS infrastructure with an AI CLI?
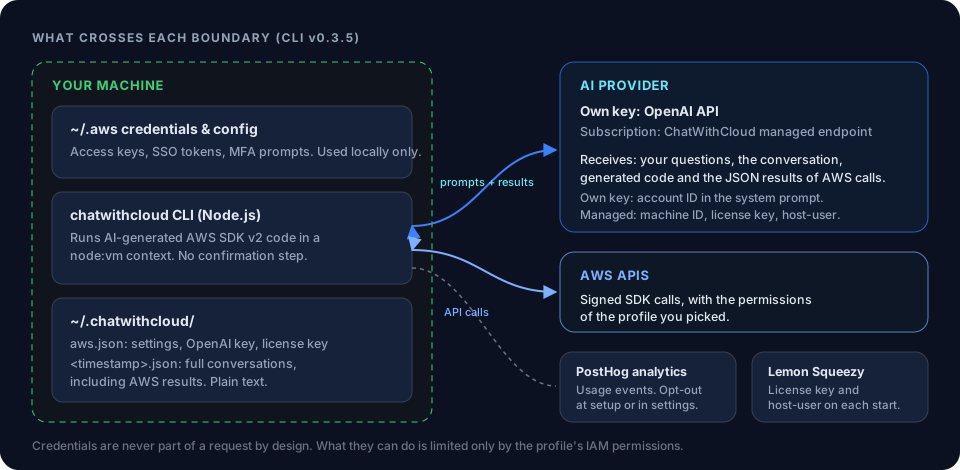
Each question goes through the same loop. The AI model writes a short script using the AWS SDK for JavaScript v2, the script runs on your machine inside a Node.js vm context with the profile you picked, and only the minimal JSON result goes back to the model, which writes the answer. If the script fails, the error goes back to the model and it retries with a fix. The full request loop is explained on How it works.
Because the session keeps context, you can follow a thread: ask about an alarm, then “show me that metric for the last 3 hours”, then “any errors in its log group around 14:05?”. That follow-up pattern is what makes the terminal useful during an incident.
What do you need before you start?
- Node.js and a way to run the CLI:
npx chatwithcloud,pnpm dlx chatwithcloud,bunx chatwithcloud, or Homebrew withbrew tap chatwithcloud/tap && brew install chat-with-cloud. - An AWS profile in
~/.aws/credentialsor~/.aws/config. IAM Identity Center (SSO) profiles work; runaws sso loginfirst forsso-sessionprofiles. The steps to connect ChatWithCloud to an AWS profile, SSO login or role cover each case. - The right region. The region comes from the profile (default
us-east-1), and a session uses one profile and one region. If the incident is ineu-west-1, set that region on the profile before you start. - A read-only role. Generated code runs without a confirmation step, so troubleshoot with a profile that can’t change anything. The policy below covers it.
Skip the profile picker when you’re in a hurry:
AWS_PROFILE=prod-readonly npx chatwithcloudThe alarm to root cause workflow, step by step
Most incidents follow the same path. Ask these in order and stop as soon as you have the cause. The sequence mirrors the observe, hypothesize and test method in the effective troubleshooting chapter of Google’s SRE book: gather evidence about the symptom first, then narrow down to what changed.
- Confirm the symptomAsk which CloudWatch alarms are in the
ALARMstate and when they changed. This anchors everything else to a resource and a timestamp. Under the hood that’sDescribeAlarmsand, for the timeline,DescribeAlarmHistory. - Look at the metric around the alarmAsk for the alarm’s metric over a window that starts well before the breach, such as 3 hours. A step change points at a deploy or config change; a slow climb points at load or a leak.
- Check the dependency metricsAsk about what sits next to the failing resource: target health behind a load balancer, database connections and CPU, Lambda throttles. “Why are my 5xx errors up” is often answered by an unhealthy target or a saturated database. If no target has been healthy for weeks, the load balancer may simply be abandoned; see how to find unused load balancers with no healthy targets.
- Read the logs for the same windowAsk for error lines in the relevant log group between two timestamps. Name the log group if you know it. Narrow windows keep CloudWatch Logs Insights scans (billed per GB scanned) small.
- Find what changedAsk which API calls modified the resource in the last few hours. CloudTrail event history (
LookupEvents) covers the last 90 days of management events in the region, which catches security group edits, deploys and parameter changes. - Check the configurationFinally, ask for the current config of the suspect resource: security group rules, target group health check path, Lambda timeout and memory, RDS parameter group. Compare it with what you expect.
An example session: 502s from a load balancer
This is an illustrative transcript, trimmed for length. Your wording and results will differ, and the answers depend on the data in your account.
$ AWS_PROFILE=prod-readonly npx chatwithcloud

> Which CloudWatch alarms are in ALARM state in this region, and when did each one change state?
  1 alarm: api-alb-5xx (HTTPCode_ELB_5XX_Count on app/api-prod/...) went to ALARM at 14:07 UTC.

> Show target health for every target group behind api-prod.
  tg-api-prod: 2 of 4 targets unhealthy (Target.FailedHealthChecks) since about 14:05 UTC.

> Which API calls changed security groups or target groups for api-prod in the last 3 hours?
  ModifyTargetGroup at 14:03 UTC by role/deploy-pipeline: HealthCheckPath changed from /health to /healthz.

> What does the app log in /ecs/api-prod say about /healthz between 14:00 and 14:15 UTC?
  38 lines like "GET /healthz 404". The service doesn't serve /healthz.
Four questions got from a symptom (5xx alarm) to a probable cause (a pipeline changed the health check path to a route the app doesn’t serve). The fix is still yours to make, through your pipeline, with a role that has write access.
Questions that diagnose AWS errors in plain English
Good troubleshooting questions name a resource, a time window and a signal. Vague questions (“why is prod slow?”) make the model guess which of dozens of services to query. If you don’t know the resource names yet, first list AWS resources with natural language from your terminal, then ask about the one that looks wrong.
Networking and load balancers
- Which targets are unhealthy behind load balancer
api-prod, and what reason code does each one show? - Does security group
sg-0abcallow inbound 443 from the load balancer’s security group?
Two networking failures have their own read-only scripts that check each link in the chain: troubleshoot why you can’t SSH into an EC2 instance, and troubleshoot a Route 53 domain not serving CloudFront.
Compute and databases
- Which EC2 instances in this region failed a status check in the last hour?
- What were CPU and
DatabaseConnectionsfor RDS instanceorders-dbbetween 13:30 and 14:30 UTC? - List RDS events for
orders-dbin the last 24 hours.
Serverless
- Which Lambda functions had errors or throttles in the last hour? (For a full walkthrough, see how to ask AI about Lambda errors in your AWS account.)
- What timeout and memory is
checkout-handlerconfigured with, and how close did its max duration get today?
Permissions needed for read-only troubleshooting
Whatever permissions the profile has, ChatWithCloud has. AWS’s ReadOnlyAccess managed policy covers the whole workflow above, including Logs Insights queries and CloudTrail lookups. If you want something narrower for on-call, this policy covers the questions in this guide. Most Describe and List actions don’t support resource-level permissions, so they use "Resource": "*"; nothing here can modify a resource. The same read-only profile also works when you analyze your AWS security posture with an AI CLI.
{
  "Version": "2012-10-17",
  "Statement": [
    {
      "Sid": "AlarmsAndMetrics",
      "Effect": "Allow",
      "Action": [
        "cloudwatch:DescribeAlarms",
        "cloudwatch:DescribeAlarmHistory",
        "cloudwatch:GetMetricData",
        "cloudwatch:ListMetrics"
      ],
      "Resource": "*"
    },
    {
      "Sid": "LogsRead",
      "Effect": "Allow",
      "Action": [
        "logs:DescribeLogGroups",
        "logs:StartQuery",
        "logs:GetQueryResults",
        "logs:StopQuery",
        "logs:FilterLogEvents"
      ],
      "Resource": "*"
    },
    {
      "Sid": "RecentChanges",
      "Effect": "Allow",
      "Action": "cloudtrail:LookupEvents",
      "Resource": "*"
    },
    {
      "Sid": "ResourceConfig",
      "Effect": "Allow",
      "Action": [
        "ec2:DescribeInstances",
        "ec2:DescribeInstanceStatus",
        "ec2:DescribeSecurityGroups",
        "elasticloadbalancing:DescribeLoadBalancers",
        "elasticloadbalancing:DescribeTargetGroups",
        "elasticloadbalancing:DescribeTargetHealth",
        "rds:DescribeDBInstances",
        "rds:DescribeEvents",
        "lambda:ListFunctions",
        "lambda:GetFunctionConfiguration"
      ],
      "Resource": "*"
    }
  ]
}
To limit which logs can be read, replace the LogsRead resource with log group ARNs such as arn:aws:logs:us-east-1:123456789012:log-group:/aws/lambda/* and keep logs:DescribeLogGroups and logs:StopQuery on "*". Log lines are part of the JSON that goes to the model, so scoping log access also scopes what leaves your machine. The page on what ChatWithCloud sends to the model lists exactly what leaves your machine.
Common mistakes and how to fix them
- “It says there are no alarms, but I can see them.” Almost always the region. The session uses the profile’s region; start a new session with a profile set to the right one.
- AccessDenied on logs or CloudTrail. The model gets the error and retries, but it can’t grant itself permissions. Add the missing action from the policy above to the role, and if it still fails, follow the steps to troubleshoot AWS IAM access denied errors step by step.
- Logs Insights scans too much. “Search all logs for errors” can scan many GB. Name the log group and a window of minutes or hours. Check current rates on AWS’s CloudWatch pricing page.
- Timezone confusion. CloudWatch and CloudTrail store UTC. Say “UTC” in your question, or you’ll compare the wrong windows.
- Asking it to fix things on a write-enabled profile. Changes run without a confirmation step. If you want the CLI to apply a fix, do it deliberately with a separate profile, and prefer your normal deploy path during an incident.
Where AI diagnosis falls short
An AI CLI is good at gathering evidence quickly. It is not an incident commander, and it helps to know its limits up front.
- It can be wrong. The model can pick the wrong metric, misread a timestamp or jump to a cause. Treat its conclusion as a hypothesis and check the numbers it quotes.
- It only sees what the APIs return. Application bugs that don’t log, client-side problems and anything outside AWS are invisible to it.
- One region per session. Cross-region failovers or global services need separate sessions.
- SDK v2 coverage. The generated code uses AWS SDK for JavaScript v2, which reached end-of-support on 8 September 2025, so services launched after that may be missing.
- AWS-side outages. To check whether AWS itself has an issue, the AWS Health API needs a Business-level or Enterprise support plan; otherwise it returns
SubscriptionRequiredException, according to AWS’s Health API documentation. The AWS Health Dashboard in the console works without one.
Frequently asked questions
Can I investigate AWS outages from the terminal with ChatWithCloud?
Yes, for anything your profile can read: alarms, metrics, logs, CloudTrail events and resource configuration in the session’s region. It runs AWS SDK calls from your machine, so it sees the same data the APIs return to you, not AWS’s internal status.
Can I ask AI why an AWS service is failing?
You can, and it works best when you name the resource and the time. “Why are 5xx errors up on api-prod since 14:00 UTC?” gives the model a starting point; “why is AWS broken?” doesn’t.
Will it restart instances or change configuration on its own?
It runs whatever code the model writes, with no confirmation step, so it can if your profile allows it and your question asks for a change. Use a read-only profile to troubleshoot and a separate profile for deliberate changes.
Does troubleshooting with it cost anything on the AWS side?
The API calls are billed as usual. The ones to watch are Logs Insights queries (per GB scanned) and GetMetricData (per metric requested). Narrow time windows keep both small. If a noisy investigation shows up on the invoice, you can ask AI why your AWS bill increased the same way, or check this month’s CloudWatch cost by usage type with a Cost Explorer script.
How much does ChatWithCloud cost?
Your first 15 runs are free and don’t need an OpenAI key. After that, see ChatWithCloud’s monthly, yearly and lifetime plans.
Related guides
Investigate Lambda errors with CloudWatchThe manual CloudWatch workflow for a failing function.
 Security modelWhat leaves your machine and how to set up a read-only role.
 Monitor AWS service quota usage and get alertsTrack account limits and get alerted before you hit them.
Ask AI about Lambda errorsFind failing functions, read their logs and spot timeouts.
Connect ChatWithCloud to your AWS accountProfiles, SSO and read-only roles for a session.
 AWS practical examplesRunnable SDK scripts for the same checks, without the AI.
Ask your AWS account in plain English
Your first 15 runs are free, with no OpenAI key needed.
npx chatwithcloud