
Photo by Chris Ried on Unsplash
You can ask AI about Lambda errors in AWS by running ChatWithCloud with a read-only profile and asking questions like “Which Lambda functions had errors in the last hour?” It writes AWS SDK code that reads Lambda’s CloudWatch metrics and logs, runs it on your machine, and explains the result. Follow-up questions let you drill from a failing function into its log lines.
This guide is for developers and on-call engineers who own Lambda functions and want to go from “something is failing” to the exact error without opening the Lambda, CloudWatch and Logs Insights consoles. When you ask AI about Lambda errors in AWS this way, you get the questions that work, what each one calls under the hood, the permissions to grant, and a standalone script for when you’d rather not use AI at all. It’s a Lambda-focused companion to the broader workflow to troubleshoot AWS infrastructure with an AI CLI; if you haven’t set up the tool yet, install the ChatWithCloud CLI with npx, Homebrew, pnpm or Bun first.
Which Lambda questions can you ask an AI CLI?
ChatWithCloud answers by writing a short AWS SDK for JavaScript v2 script, running it locally in a Node.js vm context with your profile, and sending only the minimal JSON result back to the model (the question-to-SDK-code loop is explained step by step). For Lambda, most answers come from three places: the Lambda API (function configuration), CloudWatch metrics in the AWS/Lambda namespace, and the function’s log group in CloudWatch Logs.
Questions that work well:
- Failing functions: “Which Lambda functions had errors in the last hour, and how many?”
- Error rate, not just count: “For each function with errors today, what was the error rate (errors divided by invocations)?”
- Throttling: “Did any function get throttled in the last 24 hours?”
- Slow functions: “Which functions had a p95 duration above 5 seconds today?”
- Timeouts: “Show log lines containing ‘Task timed out’ for
checkout-handlerin the last 3 hours.” - Configuration: “What timeout, memory and runtime does
checkout-handlerhave?” If the runtime is old, a script can find Lambda functions on deprecated runtimes across every region. If the memory setting looks far above what the function uses, a script can find Lambda functions with too much memory by comparing peak usage with it. - Unused functions: “Which functions had zero invocations in the last 30 days?” For inventory questions like this across other services, see how to list AWS resources with natural language.
Which Lambda metrics matter when you ask about errors?
Knowing the metrics helps you phrase questions and check the answers. These definitions come from AWS’s Lambda function metrics documentation.
| Metric | What it counts | Ask about it when |
|---|---|---|
Errors |
Invocations that end in a function error: exceptions from your code and from the runtime, including timeouts | You want failing functions |
Invocations |
Times your code ran, successful or not. Throttled requests are not counted | You need the error rate |
Throttles |
Requests rejected because no concurrency was available (TooManyRequestsException) |
Callers see failures but Errors is flat |
Duration |
Time spent processing an event, in milliseconds; supports percentiles such as p95 | You’re hunting slow functions or near-timeouts |
ConcurrentExecutions |
Instances processing events at once | Throttles appear under load |
Note: a throttled request is counted in neither Invocations nor Errors. If a caller reports failures and “which functions had errors” says none, ask about throttles next.
How to ask AI about Lambda errors in AWS, step by step
- Start with a read-only profile in the right regionRun
AWS_PROFILE=lambda-readonly npx chatwithcloud. The region comes from the profile (defaultus-east-1) and a session uses one profile and one region, so pick the region your functions run in. The guide to connect ChatWithCloud to your AWS account covers profiles, SSO and roles. - Find the failing functionsAsk which functions had errors or throttles in a specific window. The model will typically call
ListFunctionsand thenGetMetricDatafor theErrorsandThrottlesmetrics. - Get the rate and the timingAsk for errors divided by invocations in 5-minute buckets. A spike at one timestamp suggests a deploy or a bad input; a steady rate suggests a code path that always fails.
- Read the logsAsk for error lines from that function’s log group in the window you just found. By default that’s
/aws/lambda/<function-name>; if you configured a custom log group, name it in the question. - Check configuration against the symptomTimeouts point at the timeout setting (default 3 seconds, up to 900 seconds for standard functions) or a slow dependency. Memory errors point at the memory setting. Ask for both, plus the function’s event source mappings if it reads from SQS, Kinesis or DynamoDB.
An example session: a function that started timing out
This transcript is illustrative and trimmed. The answers come from your account’s data and will differ.
$ AWS_PROFILE=lambda-readonly npx chatwithcloud

> Which Lambda functions had errors in the last hour?
  2 functions: checkout-handler (41 errors / 1,280 invocations), image-resize (3 / 9,904).

> For checkout-handler, show errors and max duration in 5-minute buckets.
  Errors start at 10:35 UTC. Max duration sits at 6,000 ms from 10:35, which is the configured timeout.

> Show the error lines from its log group between 10:30 and 10:45 UTC.
  41 lines: "Task timed out after 6.00 seconds". The lines before them show calls to payments-api.

> What's its timeout, memory and VPC config?
  Timeout 6 s, memory 512 MB, attached to 2 private subnets.
The AI has narrowed it to “the function waits on payments-api until it hits its 6-second timeout”. Whether that’s a slow dependency, a missing NAT route or a connection pool problem is your call to verify; the answer gives you where to look, not a guaranteed root cause.
Query Lambda CloudWatch logs in plain English, or with a script
When you ask for log lines, the model usually runs a CloudWatch Logs Insights query or filters the log group directly. If you want the same answer without AI, for a runbook or a scheduled job, here is a complete script using the AWS SDK for JavaScript v3. It runs a Logs Insights query for errors and timeouts on one function.
import {
  CloudWatchLogsClient,
  StartQueryCommand,
  GetQueryResultsCommand,
} from "@aws-sdk/client-cloudwatch-logs";

const functionName = process.argv[2];
const hours = Number(process.argv[3] ?? "1");

if (!functionName || !Number.isFinite(hours) || hours <= 0) {
  console.error("Usage: npx tsx lambda-errors.ts <function-name> [hours]");
  process.exit(1);
}

const client = new CloudWatchLogsClient({});

const queryString = [
  "fields @timestamp, @requestId, @message",
  "| filter @message like /ERROR|Task timed out/",
  "| sort @timestamp desc",
  "| limit 50",
].join("\n");

async function main(): Promise<void> {
  const endTime = Math.floor(Date.now() / 1000);
  const startTime = endTime - Math.round(hours * 3600);

  const { queryId } = await client.send(
    new StartQueryCommand({
      logGroupName: `/aws/lambda/${functionName}`,
      startTime,
      endTime,
      queryString,
    }),
  );
  if (!queryId) throw new Error("StartQuery returned no queryId");

  for (;;) {
    await new Promise((resolve) => setTimeout(resolve, 1000));
    const res = await client.send(new GetQueryResultsCommand({ queryId }));

    if (res.status === "Complete") {
      for (const row of res.results ?? []) {
        const f = Object.fromEntries(row.map((c) => [c.field, c.value]));
        console.log(`${f["@timestamp"]}  ${f["@requestId"] ?? "-"}  ${String(f["@message"] ?? "").trim()}`);
      }
      const scanned = res.statistics?.bytesScanned ?? 0;
      console.log(`${res.results?.length ?? 0} matching events, ${scanned} bytes scanned`);
      return;
    }
    if (res.status === "Failed" || res.status === "Cancelled" || res.status === "Timeout") {
      throw new Error(`Query ended with status ${res.status}`);
    }
  }
}

main().catch((err) => {
  console.error(err);
  process.exit(1);
});
Install the client and run it with the same profile:
npm install @aws-sdk/client-cloudwatch-logs
AWS_PROFILE=lambda-readonly AWS_REGION=eu-west-1 npx tsx lambda-errors.ts checkout-handler 3
AWS’s Logs Insights sample queries in the CloudWatch Logs documentation include Lambda-specific ones. For slow invocations, filter on @type = "REPORT" and @duration, which is in milliseconds. More runnable scripts like this live in the AWS practical examples hub with SDK scripts, including one to invoke a Lambda function with AWS SDK v3 in TypeScript. If you have older v2 Lambda tooling to port, the free AWS SDK v2 to v3 converter gives you a starting point to review. To run those queries from your own code, see how to run CloudWatch Logs Insights queries with AWS SDK v3.
Permissions needed
ChatWithCloud has exactly the permissions of the profile you choose. AWS’s ReadOnlyAccess managed policy covers every question in this guide. For a narrower on-call role, this policy lets the CLI (and the script above) read Lambda configuration, metrics and the default Lambda log groups, and nothing else. Replace the account ID with yours. For your own scripts, the IAM policy generator for TypeScript code can draft a similar starting policy.
{
  "Version": "2012-10-17",
  "Statement": [
    {
      "Sid": "LambdaConfig",
      "Effect": "Allow",
      "Action": [
        "lambda:ListFunctions",
        "lambda:GetFunctionConfiguration",
        "lambda:ListEventSourceMappings",
        "lambda:GetFunctionEventInvokeConfig"
      ],
      "Resource": "*"
    },
    {
      "Sid": "LambdaMetrics",
      "Effect": "Allow",
      "Action": [
        "cloudwatch:GetMetricData",
        "cloudwatch:ListMetrics",
        "cloudwatch:DescribeAlarms"
      ],
      "Resource": "*"
    },
    {
      "Sid": "LambdaLogGroups",
      "Effect": "Allow",
      "Action": [
        "logs:StartQuery",
        "logs:GetQueryResults",
        "logs:FilterLogEvents"
      ],
      "Resource": "arn:aws:logs:*:123456789012:log-group:/aws/lambda/*"
    },
    {
      "Sid": "LogsDiscovery",
      "Effect": "Allow",
      "Action": [
        "logs:DescribeLogGroups",
        "logs:StopQuery"
      ],
      "Resource": "*"
    }
  ]
}
Log lines go to the model as part of the answer, so anything your functions log (request payloads, emails, tokens) can leave your machine. The ChatWithCloud security overview of what is sent spells out what leaves your machine and where it goes.
Troubleshooting and common mistakes
- “No functions found.” Wrong region or profile. Functions are regional and the session uses one region.
- Empty log results. The function may log to a custom log group, the window may be too narrow, or logs may be in UTC while you asked in local time. Name the log group and say “UTC”.
AccessDeniedExceptiononStartQuery. The role can’t read that log group. Check the ARN in the policy matches the log group name.- Errors are zero but callers fail. Look at
Throttles, and for asynchronous invocations remember Lambda retries failed events twice by default, so one bad event can show up as three errors. - Expensive log questions. “Search every function’s logs for the last week” scans a lot. Logs Insights is billed per GB scanned, according to AWS’s CloudWatch pricing page. If a spend jump follows, you can ask AI why your AWS bill increased from the same terminal, or run a script to get this month’s AWS CloudWatch cost by usage type.
What it can’t do
- It can misread data or suggest the wrong cause. Check the numbers it quotes before acting.
- It sees metrics, logs and configuration, not your code or your tracing data unless your profile can read them and you ask.
- The generated code uses AWS SDK for JavaScript v2 (end-of-support 8 September 2025), so newer Lambda features may be missing from what it can query.
- It won’t stop itself from changing things. Generated code runs without confirmation, so “raise the timeout to 30 seconds” on a write-enabled profile will do it.
Frequently asked questions
Can I list failing Lambda functions with natural language?
Yes. “Which Lambda functions had errors in the last hour?” is one of the most reliable questions because it maps directly to the Errors metric. Add “and their error rate” to avoid chasing a function with 3 errors out of 100,000 invocations.
How do I find Lambda invocations from the terminal?
Ask “How many invocations did each function have in the last 24 hours, highest first?” It reads the Invocations metric, which equals the number of billed requests. For a standalone script, see how to get Lambda invocation counts for the last 24 hours with SDK v3.
Can I identify slow Lambda functions with an AI CLI?
Yes. Ask for p95 or maximum Duration per function and compare it with each function’s configured timeout. Functions whose max duration equals their timeout are timing out.
Does it send my Lambda logs to OpenAI?
Log lines returned by the AWS calls are sent for processing: to OpenAI if you use your own key, or to ChatWithCloud’s managed endpoint on the trial or a subscription (see the ChatWithCloud trial and subscription plans). AWS credentials are never sent.
Related guides
Troubleshoot AWS infrastructure with an AI CLIThe alarm-to-root-cause workflow for any service.
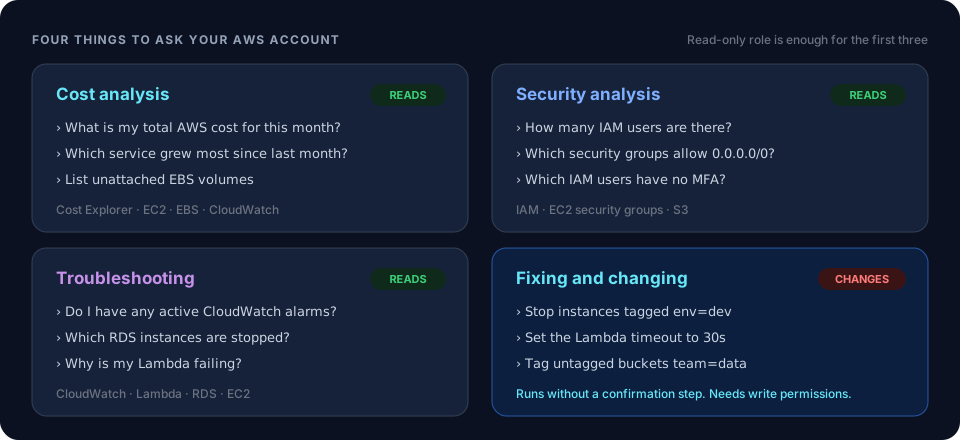 Use casesMore troubleshooting questions, including Lambda and EC2.
How to investigate Lambda errors with CloudWatchThe manual CloudWatch workflow, without an AI CLI.
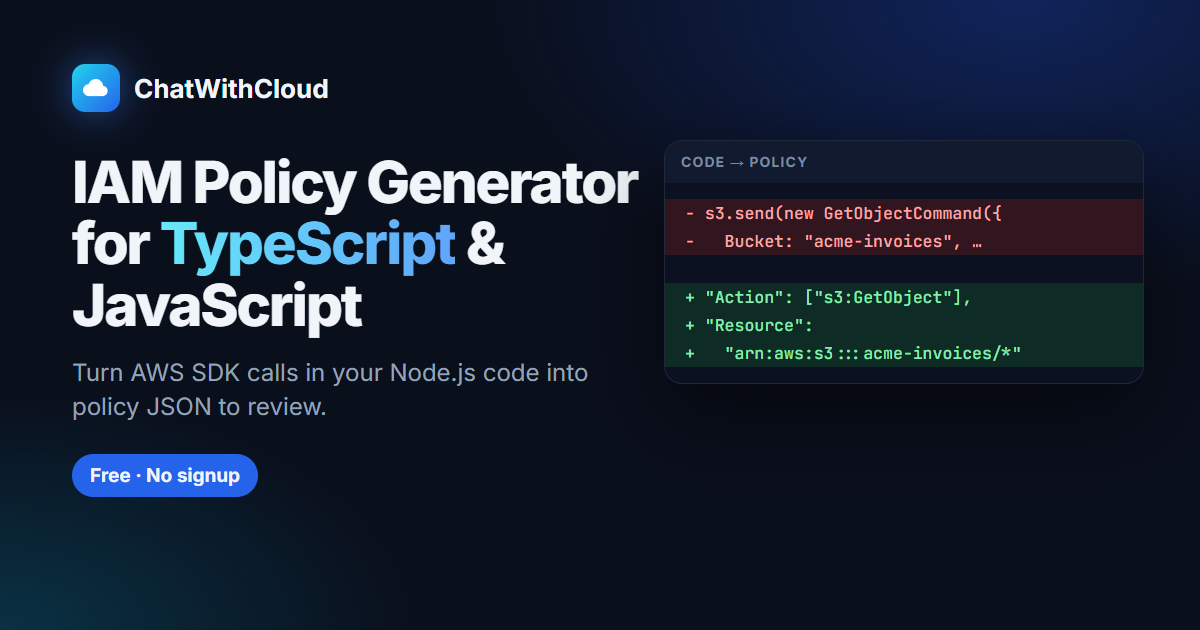 IAM policy from TypeScript codeDraft a policy for scripts like the one above.
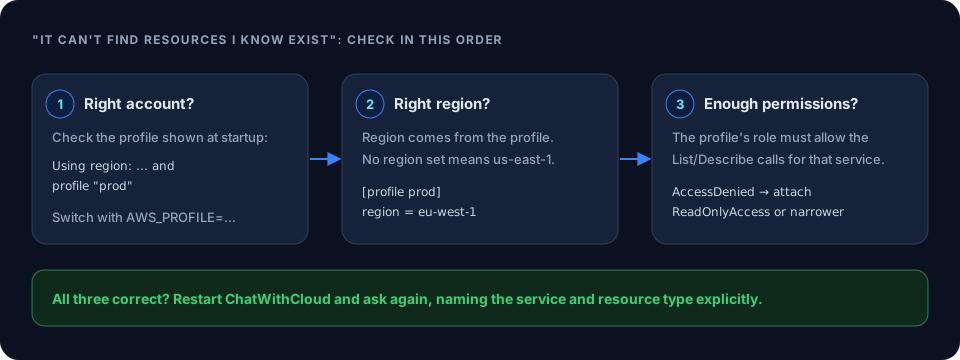 FAQProfiles, regions, pricing and troubleshooting answers.
 Delete Old and Unused Lambda Function VersionsA report-first script that prunes versions no alias uses.
Ask your AWS account in plain English
Your first 15 runs are free, with no OpenAI key needed.
npx chatwithcloud