
Photo by Lightsaber Collection on Unsplash
How to investigate Lambda errors with CloudWatch: start with the Errors, Invocations and Throttles metrics in the AWS/Lambda namespace to find which functions fail and when. Then query those functions’ log groups with CloudWatch Logs Insights for the error lines, and compare Duration and memory in the REPORT lines against each function’s timeout and memory settings.
This guide is for developers and on-call engineers who own Lambda functions and want a repeatable way to go from an alert to a cause. You’ll learn how to investigate Lambda errors with CloudWatch by hand, with the AWS CLI and a TypeScript script, what the log queries cost, and how ChatWithCloud can compress the same workflow into a few questions. If you’d rather start from plain-English questions, the companion guide shows how to ask AI about Lambda errors in your AWS account.
Which CloudWatch metrics show Lambda errors?
Lambda publishes invocation metrics for every function at no extra setup. Read them with the Sum statistic; each failed invocation adds 1 to Errors. According to the AWS Lambda documentation:
| Metric | What it tells you | Watch out for |
|---|---|---|
Errors |
Invocations that ended in a function error: exceptions from your code and runtime errors such as timeouts | Timestamped when the invocation started, not when it failed |
Invocations |
Times your code ran, success or failure; equals billed requests | Throttled requests aren’t counted |
Throttles |
Requests rejected with TooManyRequestsException because no concurrency was available |
Not counted in Errors or Invocations |
Duration |
Milliseconds spent processing an event; supports p95 and p99 | Excludes cold start (init) time |
AsyncEventsDropped |
Async events dropped after retries or maximum event age | Failures here never reach your code’s logs |
Divide Errors by Invocations for an error rate. Ten errors in 20 invocations is an outage; ten in 2 million is noise. For asynchronous invocations, also check where the failed events went: once Lambda’s retries run out, an event is discarded unless the function has somewhere to send it, which the script to find Lambda functions without an async failure destination checks.
Prerequisites
- AWS CLI v2 (the
aws logs tailcommand is v2 only) and a profile with read access to Lambda, CloudWatch and CloudWatch Logs. - Node.js 18+ with
tsxif you want to run the TypeScript script below. - The function’s region. Metrics and log groups are regional.
How to investigate Lambda errors with CloudWatch, step by step
- Find the failing functionsRank every function by
Errorsfor the last 24 hours, withInvocationsandThrottlesalongside. The script in the next section does this for a whole region in one run. - Find when it startedGraph
Errorsfor the worst function in 5-minute buckets. A step change points at a deploy, a config change or a dependency; a steady trickle points at bad inputs. - Read the error linesTail or query the log group,
/aws/lambda/<function-name>by default, around the start time. Logs can take a few minutes to appear after an invocation. - Classify the failureTimeouts, out-of-memory, unhandled exceptions, permission errors and throttles each need a different fix. The queries below separate them.
- Check configuration against the symptomCompare max
Durationwith the timeout (up to 900 seconds) and peak memory with the memory setting (128 MB to 10,240 MB).
Find Lambda functions with errors in the last 24 hours
The console shows one function at a time. This script lists every function in the region and fetches Invocations, Errors and Throttles for each with batched GetMetricData calls, then prints the worst offenders first. It uses the AWS SDK for JavaScript v3.
import { LambdaClient, paginateListFunctions } from "@aws-sdk/client-lambda";
import { CloudWatchClient, GetMetricDataCommand } from "@aws-sdk/client-cloudwatch";
import type { MetricDataQuery } from "@aws-sdk/client-cloudwatch";

const hours = Number(process.argv[2] ?? "24");
if (!Number.isInteger(hours) || hours < 1 || hours > 24 * 14) {
  console.error("Usage: npx tsx lambda-error-report.ts [hours between 1 and 336]");
  process.exit(1);
}

const METRICS = ["Invocations", "Errors", "Throttles"];
const lambda = new LambdaClient({});
const cloudwatch = new CloudWatchClient({});

interface Row {
  name: string;
  Invocations: number;
  Errors: number;
  Throttles: number;
}

async function listFunctionNames(): Promise<string[]> {
  const names: string[] = [];
  for await (const page of paginateListFunctions({ client: lambda }, {})) {
    for (const fn of page.Functions ?? []) {
      if (fn.FunctionName) names.push(fn.FunctionName);
    }
  }
  return names;
}

async function main(): Promise<void> {
  const endTime = new Date();
  const startTime = new Date(endTime.getTime() - hours * 3600 * 1000);
  const names = await listFunctionNames();
  const rows: Row[] = names.map((name) => ({ name, Invocations: 0, Errors: 0, Throttles: 0 }));

  // GetMetricData accepts up to 500 queries per request.
  const perRequest = Math.floor(500 / METRICS.length);
  for (let start = 0; start < rows.length; start += perRequest) {
    const chunk = rows.slice(start, start + perRequest);
    const queries: MetricDataQuery[] = [];
    chunk.forEach((row, i) => {
      METRICS.forEach((metric, m) => {
        queries.push({
          Id: `f${i}_m${m}`,
          MetricStat: {
            Metric: {
              Namespace: "AWS/Lambda",
              MetricName: metric,
              Dimensions: [{ Name: "FunctionName", Value: row.name }],
            },
            Period: hours * 3600,
            Stat: "Sum",
          },
          ReturnData: true,
        });
      });
    });

    let nextToken: string | undefined;
    do {
      const res = await cloudwatch.send(
        new GetMetricDataCommand({
          MetricDataQueries: queries,
          StartTime: startTime,
          EndTime: endTime,
          NextToken: nextToken,
        }),
      );
      for (const result of res.MetricDataResults ?? []) {
        const match = /^f(\d+)_m(\d+)$/.exec(result.Id ?? "");
        if (!match) continue;
        const row = chunk[Number(match[1])];
        const metric = METRICS[Number(match[2])] as "Invocations" | "Errors" | "Throttles";
        row[metric] += (result.Values ?? []).reduce((a, b) => a + b, 0);
      }
      nextToken = res.NextToken;
    } while (nextToken);
  }

  const failing = rows
    .filter((r) => r.Errors > 0 || r.Throttles > 0)
    .sort((a, b) => b.Errors - a.Errors || b.Throttles - a.Throttles);

  console.log(`${names.length} functions checked, ${failing.length} with errors or throttles in the last ${hours}h`);
  for (const r of failing) {
    const rate = r.Invocations > 0 ? ((r.Errors / r.Invocations) * 100).toFixed(2) : "n/a";
    console.log(`${r.name.padEnd(40)} errors=${r.Errors} invocations=${r.Invocations} rate=${rate}% throttles=${r.Throttles}`);
  }
}

main().catch((err) => {
  console.error(err);
  process.exit(1);
});npm install @aws-sdk/client-lambda @aws-sdk/client-cloudwatch
AWS_PROFILE=oncall-readonly AWS_REGION=eu-west-1 npx tsx lambda-error-report.ts 24
# 38 functions checked, 2 with errors or throttles in the last 24h
# checkout-handler errors=41 invocations=1280 rate=3.20% throttles=0
# image-resize errors=3 invocations=9904 rate=0.03% throttles=12The whole window is requested as a single period, so CloudWatch may return two datapoints if the window isn’t aligned; the script sums them. For a per-function invocation breakdown, the runnable example to get Lambda invocation counts for the last 24 hours goes deeper, and the AWS practical examples hub has more scripts like it.
Filter CloudWatch logs for Lambda exceptions
Once you know the function and the time, read the logs. For a quick look, tail the log group with a filter pattern:
aws logs tail /aws/lambda/checkout-handler --since 1h --format short \
  --filter-pattern "?ERROR ?Exception ?\"Task timed out\""
For anything bigger, use CloudWatch Logs Insights. A single query can cover up to 50 log groups, which is how you trace Lambda errors across log groups when a request passes through several functions. This query counts error lines per function:
fields @timestamp, @log, @requestId, @message
| filter @message like /(?i)(error|exception|task timed out)/
| stats count(*) as errorCount by @log
| sort errorCount desc
Then pull the lines for one request ID from every log group you selected, to follow a single failing request end to end:
fields @timestamp, @log, @message
| filter @requestId = "c6af9ac6-7b61-11e6-9a41-93e812345678" or @message like /c6af9ac6-7b61-11e6-9a41-93e812345678/
| sort @timestamp asc
You can run these from the console or the CLI with aws logs start-query followed by aws logs get-query-results. The earlier guide on asking AI about Lambda errors includes a full SDK v3 Logs Insights script if you want to automate it. Logs only show each function’s side of a request; to see the whole path across services you need X-Ray, and the script to find Lambda functions without X-Ray tracing enabled shows which functions don’t send traces yet.
How do you identify Lambda timeout errors in AWS?
A timeout is logged as Task timed out after N.NN seconds and counts as an error in the Errors metric. Two quick checks confirm it: max Duration sits at the configured timeout, and this query finds the timed-out lines per hour.
filter @message like /Task timed out/
| stats count(*) as timeouts by bin(1h)
| sort timeouts desc
Memory problems show up in the REPORT line each invocation writes. @maxMemoryUsed and @memorySize are in bytes, so a ratio gives peak usage as a percentage:
filter @type = "REPORT"
| stats max(@maxMemoryUsed / @memorySize * 100) as peakMemoryPct,
        max(@duration) as maxDurationMs,
        pct(@duration, 95) as p95DurationMs by bin(1h)
If peak memory reaches 100%, raise the memory setting, which also adds CPU in proportion. If the function times out while waiting on a network call, a higher timeout only hides the problem; check the dependency, and for functions in a VPC, the route to it. Finally, check the configuration itself with aws lambda get-function-configuration --function-name checkout-handler. The opposite case, a peak far below the setting, is wasted spend; the script to find Lambda functions with too much memory runs the same REPORT query across a Region.
Watch for retries: for asynchronous invocations, Lambda retries a failed event twice by default, so one bad event can produce three errors. Throttled async events are retried too, which is why Throttles can climb while Errors stays flat.
What do Lambda log queries cost?
Metrics are cheap; log queries are where cost hides. Prices below are for US East (N. Virginia), as of September 2026, from the Amazon CloudWatch pricing page.
| Item | Price |
|---|---|
| Logs Insights queries | $0.005 per GB of data scanned |
| Log ingestion (Standard log class) | $0.50 per GB |
| Log storage (archive) | $0.03 per GB per month |
GetMetricData |
$0.01 per 1,000 metrics requested |
| Free tier | 5 GB of log data per month across ingestion, archive storage and Logs Insights scanning |
Worked example: a runbook query that scans 7 days of logs from 10 busy functions reads about 40 GB. At $0.005 per GB that’s 40 × 0.005 = $0.20 per run. Run it 5 times per incident and 20 incidents a month and you pay 40 × 100 × 0.005 = $20. The report script above requests 3 metrics per function; for 200 functions that’s 600 metrics, or 600 ÷ 1,000 × $0.01 = $0.006 per run. Narrow the time range and log groups first, and if a spike shows up on the bill, ask AI why your AWS bill increased to see which line moved. To watch just the CloudWatch line, a Cost Explorer script can report month-to-date CloudWatch spend by usage type.
Permissions needed
This read-only policy covers the metrics script, aws logs tail, Logs Insights queries and configuration checks. Replace the account ID with yours.
{
  "Version": "2012-10-17",
  "Statement": [
    {
      "Sid": "LambdaRead",
      "Effect": "Allow",
      "Action": [
        "lambda:ListFunctions",
        "lambda:GetFunctionConfiguration"
      ],
      "Resource": "*"
    },
    {
      "Sid": "MetricsRead",
      "Effect": "Allow",
      "Action": [
        "cloudwatch:GetMetricData",
        "cloudwatch:GetMetricStatistics",
        "cloudwatch:ListMetrics"
      ],
      "Resource": "*"
    },
    {
      "Sid": "LambdaLogsRead",
      "Effect": "Allow",
      "Action": [
        "logs:FilterLogEvents",
        "logs:StartQuery"
      ],
      "Resource": "arn:aws:logs:*:123456789012:log-group:/aws/lambda/*"
    },
    {
      "Sid": "LogsQueryResults",
      "Effect": "Allow",
      "Action": [
        "logs:DescribeLogGroups",
        "logs:GetQueryResults",
        "logs:StopQuery"
      ],
      "Resource": "*"
    }
  ]
}
If no logs appear at all, the function’s execution role is the problem: it needs logs:CreateLogGroup, logs:CreateLogStream and logs:PutLogEvents, which the AWSLambdaBasicExecutionRole managed policy provides. For your own scripts, the IAM policy generator for TypeScript code drafts a starting policy; review that generated policy for least privilege before you use it.
Troubleshooting common mistakes
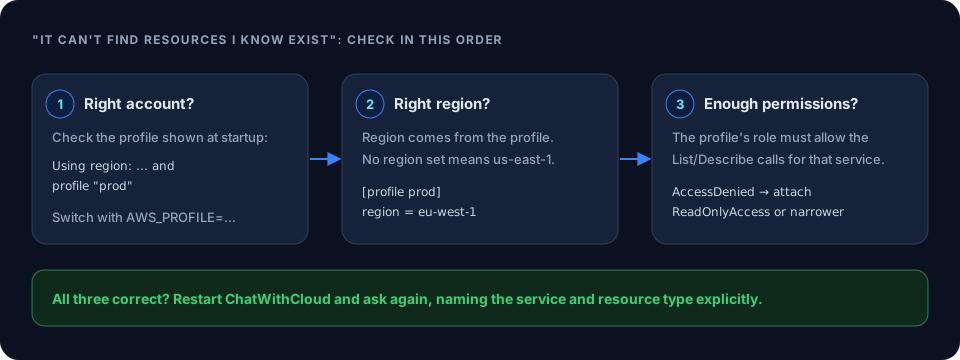
- Empty metrics. Wrong region, a misspelled function name in the
FunctionNamedimension, or a function that simply wasn’t invoked in the window. - Errors in metrics but nothing in logs. The function logs to a custom log group, or the execution role can’t write logs.
- Callers fail but
Errorsis zero. CheckThrottlesand, for callers,lambda:InvokeFunctionpermission errors, which happen before your code runs. The example to invoke a Lambda function with SDK v3 shows how the error surfaces on the caller side. - Query times look wrong. Logs Insights and the CLI use UTC. Convert your alert time first.
The ChatWithCloud shortcut
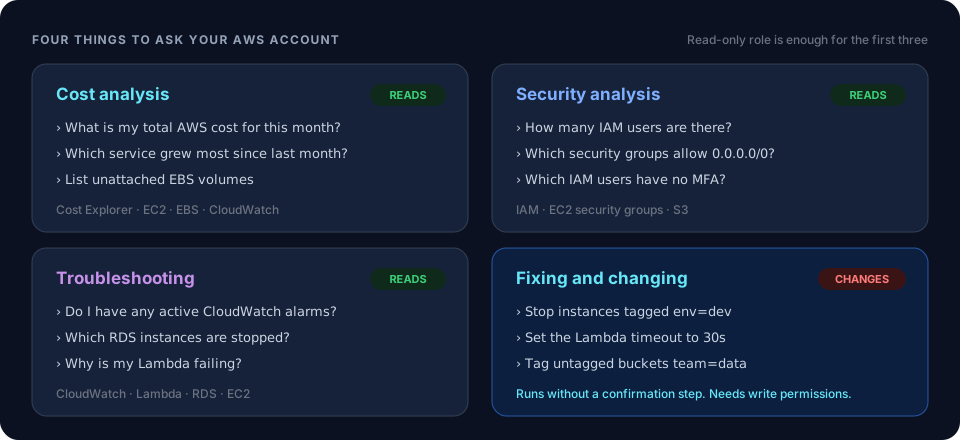
Everything above is three or four tools and a lot of copying function names between them. ChatWithCloud collapses it into a conversation: “Which Lambda functions had errors in the last 24 hours?”, then “Show the timeout lines for checkout-handler between 10:30 and 10:45 UTC”, then “What’s its timeout and memory?”. It writes AWS SDK code for each question, runs it on your machine with your profile, and explains the JSON that comes back; the step-by-step view of how ChatWithCloud works covers the loop. The same approach extends past Lambda, as the guide to troubleshoot AWS infrastructure with an AI CLI shows.
Honest limits: it can misread data, it sends log lines it retrieves to the model (see the ChatWithCloud data handling and security page), its generated code uses SDK v2, and generated code runs without confirmation. Use a read-only profile like the policy above.
Frequently asked questions
Where are Lambda logs stored in CloudWatch?
By default in a log group named /aws/lambda/<function-name> in the function’s region. You can configure a different log group per function, so check the function’s logging configuration if the default is empty.
Does a Lambda timeout count as an error?
Yes. Timeouts are runtime errors and add to the Errors metric. Throttles don’t; they have their own Throttles metric.
Can I search logs from many Lambda functions at once?
Yes. A Logs Insights query can include up to 50 log groups. Group results by @log to see which function each line came from.
How do I get alerted before users notice?
Create a CloudWatch alarm on Errors (or an error-rate metric math expression) per critical function, and one on Throttles. Standard alarms cost $0.10 per alarm metric per month in US East (N. Virginia), as of September 2026.
Related guides
Ask AI about Lambda errors in AWSThe same investigation as plain-English questions.
 Count Lambda invocations in the last 24 hoursAn SDK v3 script for per-function invocation counts.
 ChatWithCloud use cases for on-call engineersMore troubleshooting questions by service.
 ChatWithCloud FAQ for profiles and regionsSetup, pricing and data questions answered.
Troubleshoot AWS Infrastructure With an AI CLIAn alarm-to-root-cause workflow for AWS incidents using plain-English questions in…
- Invoke a Lambda Function With AWS SDK v3 in TypeScriptA complete TypeScript example for calling Lambda with InvokeCommand.
Ask your AWS account in plain English
Your first 15 runs are free, with no OpenAI key needed.
npx chatwithcloud